Story of Cosmetics KAK HAN CHONG, EUGENE CHAN, NIGEL SEBASTIAN
Summary
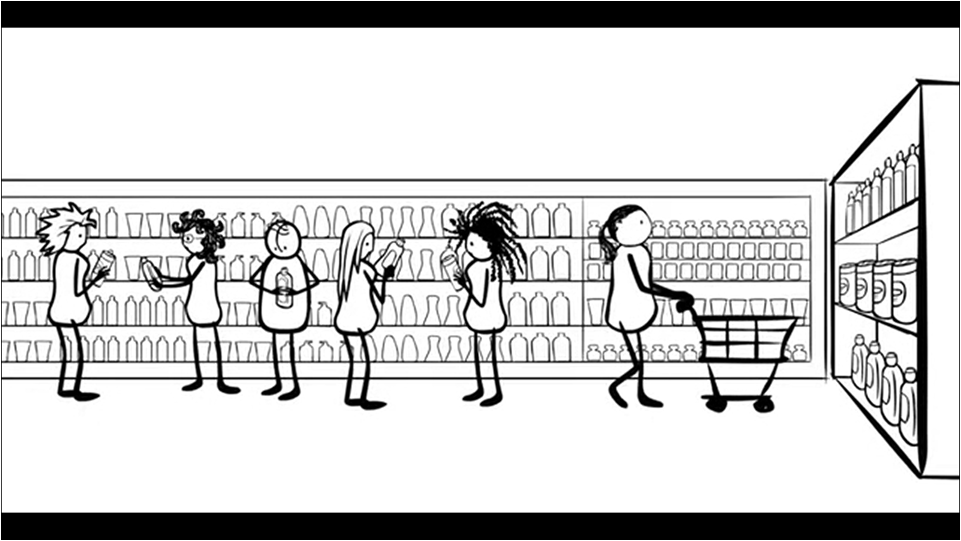
Story of stuff on cosmetics
explores the use of the concept “toxic in toxic out” in the manufacture of
Cosmetic products
Toxic chemicals identified in
many everyday amenities such as baby shampoo, Lipstick to shaving cream
and deodorants.
Short clip produced by Free
Range Studios and hosted by Annie Leonard under the story of stuff
project.
Breakdown
of informational content
• Informative – audience learns something
• Easy to
read – simple typography that is legible and readable
• Easy to
understand – Clear and crisp explanations
•
Interesting – use of animated graphics to convey message in a more interesting way although it is a
little bit too bland
• Uses quality
data – addresses large amenities manufacturers such as P & G and scientific
terms
• Has a
point of view – multiple points of view, from an activists’ POV and consumer
POV with host’s expression of love for Pantene Pro V
•
Manageable amounts of info – addresses directly the point of toxics in
cosmetics without procrastination
• Easily
distinguishable and comparable data -
Data of Men and women in America’s average daily use of cosmetics
• Good use of contrast - black and white for clarity
• Clear labeling – use of brand labels
• Created for a reason – to create awareness on what is put into our amenities
• Appropriate visual methods – illustrations of products and people and
factories
• Not wasting space – host placed at bottom right with illustrated animations
above
• Black and white factor – used to create comfortable contrast for clarity and
ease of viewing
• Avoid information overload – precise and to the point without straying off
topic
• Data dense
• Use of axis labels and scales – absent in video but replaced with animations
• Vertical or horizontal organization – horizontal, like a story board
• Use of color – nil; only use of black and white
• Data in chunks – yes, but in easy to digest chunks
• Appropriate for intended audience – fairly appropriate, aimed at the average
grocery shopper
• No distortion of data
• Legibility – easy to read with simple typography and interesting graphic
animations
• Space
management- adequate, not hard to read and understand
• Visibility across different mediums – video format, plays on almost anything
that has a screen
• Simple and organized – yes, no cluttered information or animations
• No chart junk – none at all, no charts used.
• Visually pleasing – yes however, a little boring
• Grab viewer’s attention – yes, with scientific terms and the vantage of being
able to relate to what is being addressed in video
• Balance between amount and size of text – adequate and neat
• For a general audience – yes, for average shopper.
• Consistency of content – good flow and continuous information
• Accuracy – fairly accurate, although unsure of the scientific terminology
• Encourages comparisons – yes, inter brand comparison
• Clear purpose – to create awareness about what goes into our daily care
products
• Creative – creative with animated illustrations and appealing visuals
• Engaging – engaging from the graphics and design perspective to create
awareness about products everyone uses daily
• Appropriate size – easy to read and view
• Meaningful story – meaningful because able to relate to what is being
addressed
•
Functional – effectively portrays the data
• Use of realism – animations of humans and of everyday products
• Use of noticeable differences in size – government is portrayed to be a
larger entity than the average consumer
• Appropriate use of fonts – simple font, easy to understand
• Display what is relevant – only focuses on cosmetics which is the main point
• Use of pictures – yes, animated too!
FRAMEWORK.
Which relationship should
you convey?
Think about your audience and
select the suitable info graphic device.
- This issue had involved a lot
of process and information, we personally thinks that diagrams work the
best to clearly convey the message.
Organization Principles
Literacy
Visual: They might not
understand if the video is full of text and information. So she added in
visual where it is the easiest way to make the viewer analyze, and utilize
for learning.
Semiotics: Complex information,
but she uses these types of media because it wouldn’t look boring and
complicated. Easy to approach by the viewer.
Aesthetic Principles
Grid System: They create a
neat, horizontally work video. They considered the focal point of the
video, where they divided into a few parts to systemize the video
consistency.
Color: They use plain black and
white drawing. They had make a contrast between the speaker and the
background by using bright color clothing on the lady.
Type: Spacing is wisely
arranged in the video. Negative spaces are filled with the objects
proportionally and align with text.
Communication Method
Interactive Method
It was presented in this way
because it is the fastest way to reach the audience. Besides, nowadays
people prefer web-based exploration compare to the old-fashion way of
doing awareness.
The medium they use was low
cost, and free advertising/ sharing in the social network. In this way,
video could easily view by the publicity and knowing the existence of this
awareness video.